Drawing a Gauge View with Swift 5.9 on iOS
Building a custom UIKit GaugeViewXK using CAShapeLayer, CAGradientLayer, CADisplayLink, and trigonometry to draw an animated, gradient gauge.
Introduction
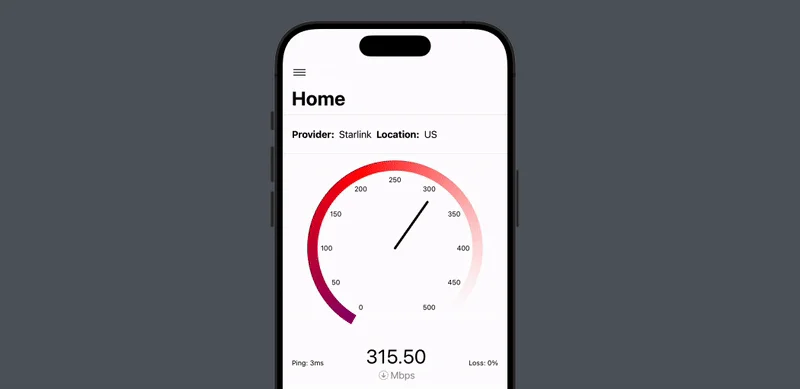
In this article, we will explore implementation of mathematical functions in software engineering translated to a custom UIKit view called GaugeViewXK. This view is designed to display a gauge, similar to those found in speedometers or other measuring instruments. We will break down the code and explain its components and logic in simple terms. This guide is aimed at mid/senior developers who are interested in learning more about draw APIs in Swift.
While we build this component, we do not seek to make it a perfect component and to use it, our intention is to explore the APIs and the way to draw views in Swift-iOS.
Purpose
The GaugeViewXK aims to visually represent a range of values on a gauge. It includes features like gradient colors, labels for different values, and a dynamic indicator that smoothly moves to the target value. The goal is to create an informative and visually appealing gauge view.
Implementation Approaches
- CAShapeLayer and CAGradientLayer: These Core Animation layers are used for drawing and animating the gauge and its components.
- CADisplayLink: Used for smooth animations of the gauge indicator.
Challenging Parts
1. Animating the Indicator
Why it’s challenging: Animating the indicator to move smoothly and accurately to the target value requires precise timing and synchronization with the display’s refresh rate. The challenge lies in ensuring that the animation is not jerky or inconsistent, especially when the target value changes frequently.
How we did it: We used CADisplayLink to create a display link that synchronizes with the screen’s refresh rate. This allows the indicator to update its position smoothly and consistently. By calculating the difference between the current value and the target value, and updating the indicator’s position incrementally, we achieved a fluid animation.
2. Drawing the gauge and labels
Why it’s challenging: Drawing the gauge involves creating a precise arc that represents the range of values. Additionally, positioning the labels accurately along this arc requires calculating their angles and positions correctly. The challenge is to ensure that the labels are evenly spaced and correctly aligned with the gauge.
How we did it: We used trigonometry to calculate the positions of the labels along the gauge’s arc. By converting angles to radians and using sine and cosine functions, we determined the (x, y) coordinates for each label. This ensured that the labels were evenly distributed and aligned with the corresponding values on the gauge. We also utilized CAShapeLayer and CAGradientLayer to draw the gauge and apply the appropriate colors or gradients.
What is a Display Link?
CADisplayLink is a timer object that allows your app to synchronize its drawing to the refresh rate of the display. It ensures smooth animations by calling a method at the display’s refresh rate.
Drawing the Gauge
The gauge is drawn using CAShapeLayer and CAGradientLayer to create a colorful arc that represents the range of values.
- Arc path: We create an arc path using UIBezierPath, specifying the center, radius, start angle, and end angle.
- Shape layer: A CAShapeLayer is used to stroke the arc path. Depending on the
gaugeColorconfiguration, we either apply a single color or create a gradient using CAGradientLayer.
The gauge’s appearance can be customized with different colors or gradients, and its thickness is controlled by the gaugeWidth property.
Drawing the Labels
Labels are drawn around the gauge to represent specific values.
- Creating labels: UILabels are created for each value and positioned at the calculated coordinates. The labels are centered and styled according to the
labelFontandlabelColorproperties. - Positioning labels: We calculate the positions for the labels along the arc of the gauge. This involves determining the angle for each label and using trigonometric functions to find the (x, y) coordinates on the arc.
This ensures that the labels are evenly distributed and aligned with the corresponding values on the gauge.
Drawing the Indicator
The indicator needle points to the current value on the gauge.
- Indicator layer: A CAShapeLayer is used to draw the indicator needle. The needle’s position is calculated based on the current value, mapping it to an angle on the gauge.
- Animating the indicator: CADisplayLink is used to smoothly animate the needle from its current position to the target value. This involves updating the needle’s position incrementally and redrawing it at each step.
Building the Gradient Layer
-
gradientLayer.type = .conicWe decide what kind of paint we are using. Here, we choose a conic gradient, which is like a rainbow circle. -
gradientLayer.startPoint = CGPoint(x: 0.5, y: 0.5)We pick the center of our canvas as the starting point for our painting. This is the middle point of the rectangle. -
gradientLayer.endPoint = CGPoint(x: 0.23, y: 2)We set where the paint should end. This point is a bit outside the middle, giving our gradient a direction. -
gradientLayer.locations = calculateGradientLocations(for: colors)We figure out where each color should be placed on our gradient. Imagine putting stickers on our canvas at certain spots. -
gradientLayer.frame = rectWe tell our canvas how big it should be. It’s the size of the rectangle we got. -
gradientLayer.colors = processGradientColors(colors: colors).map { $0.cgColor }We prepare our colors for painting. We turn each color into a type that the canvas understands and put them in order. -
gradientLayer.mask = shapeLayerWe put a stencil on our canvas. The shape layer acts like a mask, letting us paint only in certain areas.
What is UIBezierPath?
The init(arcCenter:radius:startAngle:endAngle:clockwise:) method of UIBezierPath creates a new bezier path object that represents an arc of a circle. This method is useful for drawing arcs in custom views.
Parameters
- arcCenter: A
CGPointthat defines the center of the arc. This is the point around which the arc will be drawn. - radius: A
CGFloatthat specifies the radius of the arc. It determines the distance from the center point to any point on the arc. - startAngle: A
CGFloatrepresenting the starting angle of the arc in radians. Angles are measured in the unit circle starting from the positive x-axis. - endAngle: A
CGFloatrepresenting the ending angle of the arc in radians. LikestartAngle, it is measured from the positive x-axis. - clockwise: A
Boolindicating the direction in which the arc is drawn. Iftrue, the arc is drawn in a clockwise direction.
Explanation of CGPoint calculation
let endPoint = CGPoint(
    x: center.x + radius * cos(endAngle - .pi / 2),
    y: center.y + radius * sin(endAngle - .pi / 2)
)-
Center Point
center: This is the starting point of the indicator line, typically the middle of the gauge (adjusted byindicatorWidth). -
Radius
radius: This is the length of the indicator line, calculated as half the width of the gauge minus the gauge width and some padding. -
End angle
endAngle: This is the angle (in radians) at which the indicator points, based on thecurrentSpeed. This angle is calculated earlier in the method. -
Trigonometric functions
cos(cosine) andsin(sine) are trigonometric functions that help convert the angle into x and y coordinates.Angles in trigonometry typically start from the positive x-axis (0 degrees) and go counterclockwise. However, for drawing on a screen, angles often start from the positive y-axis (90 degrees) and go clockwise. To adjust for this difference, we subtract
π/2(90 degrees) from theendAngle. -
Calculating x and y Coordinates The
xcoordinate of theendPointis calculated as:center.x + radius * cos(endAngle - .pi / 2) center.y + radius * sin(endAngle - .pi / 2)This means starting from the x-coordinate of the center, you move horizontally based on the cosine of the angle multiplied by the radius.
Visualization
- Imagine a circle with the center at
center. - The
radiusis the length from the center to the edge of the circle. - The
endAngledetermines the direction in which the indicator points. - Using
cosandsin, we translate this angle into actual x and y distances from the center to get theendPoint.
Practical Example
If you have a gauge centered at (50, 50) with a radius of 40, and the endAngle corresponds to pointing directly upwards (90 degrees or π/2 radians), the calculations would look like this:
x: 50 + 40 * cos(π/2 - π/2) = 50 + 40 * cos(0) = 50 + 40
y: 50 + 40 * sin(π/2 - π/2) = 50 + 40 * sin(0) = 50 + 40
So, the endPoint would be (90, 50), directly to the right of the center, indicating a 90-degree angle.
This calculation ensures the indicator points correctly based on the speed value, giving an accurate visual representation on the gauge.
Why building the GaugeView is fun and challenging
Creating a custom view like GaugeView is a rewarding experience for several reasons:
- Learning Core Animation: You will gain hands-on experience with CAShapeLayer, CAGradientLayer, and CADisplayLink, which are powerful tools for creating complex animations and custom drawings in iOS.
- Mathematical application: You will apply trigonometric functions to calculate positions and angles, bridging the gap between abstract math and practical coding.
- Problem-Solving: Addressing challenges such as smooth animations and precise label positioning will enhance your problem-solving skills and attention to detail.
- Visual feedback: Seeing your custom gauge come to life with smooth animations and dynamic updates provides immediate and satisfying visual feedback.
Overall, building GaugeView is an excellent project for learning and practicing advanced Swift and iOS development techniques, making it a fun and educational challenge.
Resources
For more information on the topics covered in this document, you can explore the following resources:
- Drawing on iOS
- CADisplayLink
- CADisplayLink and its applications
- CAShapeLayer
- CAGradientLayer
- UIBezierPath
- Trigonometry
Thank you for taking the time to read this article on the implementation of mathematical functions in software engineering. I hope it has sparked your curiosity about the intricacies of this essential component. See you in the article, which will be more challenging and fun!
GitHub
Find the full implementation in the GitHub repository: https://github.com/egzonpllana/SwiftAndMathematicalChallenges/tree/main/GaugeViewXK
Let’s connect
- LinkedIn: https://www.linkedin.com/in/egzon-pllana
- GitHub: https://github.com/egzonpllana